Category Archives: Blogs
Aspen and Snowmass Village Residential Real Estate 3rd Quarter Report

Aspen 3rd Quarter Report
The 3rd quarter real estate report for Aspen came back promising. Single family home prices are on the rise as inventory drops. Average sales price of single family homes are up 32% from 2013 jumping from an average sales price of $4.922M to $6.495. Median sales price has risen 53.8% from $4M to $6.15M. Days of Single family homes on market has dropped from 328 to 203, a 38.1% drop. The data suggests the single family home market is improving rapidly in Aspen. There are fewer new listings in 2014 overall and 82 single family homes have sold in 2014 compared with 66 last year. Months supply of inventory has dropped 36.3% from 25.6 months to only 16.3 months.
Single Family // Quarter 3 // Year to Date
| Key Metrics | 2013 | 2014 | % Change from
Previous Year |
Thru Q3 2013 | Thru Q3 2014 | % Change from
Previous Year |
| New Listings | 38 | 48 | +26.3% | 151 | 138 | -8.6% |
| Sold Listings | 29 | 33 | +13.8 | 66 | 82 | +24.3 |
| Median Sales Price | $4,000,000 | $6,150,000 | +53.8 | $3,462,500 | $4,443,750 | +28.3 |
| Average Sales Price | $4,922,121 | $6,495,645 | +32.0 | $5,173,447 | $5,815,632 | +12.4 |
| Percent of List Price Received | 90.7% | 93.4% | +3.0 | 89.7% | 91.7% | +2.2 |
| Days on Market Until Sale | 328 | 203 | -38.1 | 313 | 220 | -29.7 |
| Inventory of Homes for Sale | 203 | 148 | -27.1 | |||
| Months Supply of Inventory | 25.6 | 16.3 | -36.3 |
Townhouse-Condo // Quarter 3 // Year to Date
| Key Metrics | 2013 | 2014 | % Change from
Previous Year |
Thru Q3 2013 | Thru Q3 2014 | % Change from
Previous Year |
| New Listings | 55 | 49 | -10.9% | 187 | 179 | -4.3% |
| Sold Listings | 47 | 42 | -10.6 | 111 | 109 | -1.8 |
| Median Sales Price | $1,400,000 | $1,127,500 | -19.5 | $1,100,000 | $1,250,000 | +13.6 |
| Average Sales Price | $1,959,007 | $1,776,020 | -9.3 | $1,655,900 | $2,018,934 | +21.9 |
| Percent of List Received | 93.1% | 94.6% | +1.6 | 92.3% | 94.0% | +1.8 |
| Days on Market Until Sale | 180 | 193 | +7.2 | 184 | 195 | +6.0 |
| Inventory of Homes for Sale | 177 | 140 | -20.9 | |||
| Months Supply of Inventory | 14.8 | 11.5 | -22.3 |
Condos and townhouses are not rebounding with the vigor of Aspen single family homes but the good news is a deal can still be had on the heels of the last housing recession. Inventory is shrinking ever so slightly with 6 fewer new listings this quarter (down 10%), however the amount of sold listings are also down 10.6% from last year. If you look at the whole of 2014 sold listings are only down 1.8%. Sales are holding to last years levels. Median sales price is up 13.6% for the year and average sales price is up 21.9%. The condo prices are recovering nicely. Sellers are receiving 94% of asking price up marginally from 2013 when they were receiving 92.3%. Condos and townhomes are sitting the market an average of 195 days, up slightly from 2013 numbers of 184 days on market. Condo and townhomes inventory is down 20.9% and there are 11.5 months of inventory currently on the market. It still is a buyer’s market but with a shrinking inventory we should see a change in the coming months.
Snowmass Village
Single Family // Quarter 3 // Year to Date
| Key Metrics | 2013 | 2014 | % Change from
Previous Year |
Thru Q3 2013 | Thru Q3 2014 | % Change from
Previous Year |
| New Listings | 13 | 17 | +30.8% | 47 | 52 | +10.6% |
| Sold Listings | 8 | 9 | +12.5% | 21 | 29 | +38.1% |
| Median Sales Price | $1,884,000 | $1,990,000 | +5.6% | $2,100,000 | $1,850,000 | -11.9% |
| Average Sales Price | $7,371,625 | $2,754,444 | -62.6% | $4,048,714 | $2,498,207 | -38.3% |
| Percent of List Price Received | 86.2% | 90.3% | +4.8% | 89.7% | 91% | +1.4% |
| Days on Market Until Sale | 252 | 116 | -54% | 214 | 156 | -27.1% |
| Inventory of Homes for Sale | 72 | 65 | -9.7% | |||
| Months Supply of Inventory | 27.3 | 19.3 | -29.3% |
There are a third more new single family homes listed this quarter compared to last year’s 3rd quarter and 10.6% more new listings for 2014 than 2013. Sold listings in the 3rd quarter are nearly the same as last year however for 2014 over all 29 homes have sold compared to 21 in 2013, a 38.1% improvement. Median sales price is down for the year, 11.9% but up for the 3rd quarter 5.6%. Average sales price is down considerably, 38.3% for the year that may indicate a very large and expensive home could have skewed the numbers for 2013. Percent of list price received is on the rise ever so slightly up from 89.7% in 2013 to 91% in 2014. Days on the market has dropped a whopping 54%, averaging 116 days on market until sale indicating a turn for the better in the Snowmass Village single family home market. Inventory is down 9.7% and months supply of inventory has dropped a third. The market has improved markedly in Snowmass Village in 2014; a trend that by all signs will continue into the new year.
Townhouse-Condo // Quarter 3 // Year to Date
| Key Metrics | 2013 | 2014 | % Change from
Previous Year |
Thru Q3 2013 | Thru Q3 2014 | % Change from
Previous Year |
| New Listings | 27 | 35 | +29.6% | 101 | 109 | +7.9% |
| Sold Listings | 31 | 19 | -38.7% | 108 | 79 | -26.9% |
| Median Sales Price | $493,050 | $463,500 | -38.7% | $492,125 | $545,000 | +10.7% |
| Average Sales Price | $575,929 | $762,195 | +32.3% | $673,874 | $861,977 | +27.9% |
| Percent of List Received | 92.2% | 92.7% | +.05% | 93.4% | 92.2% | -1.3% |
| Days on Market Until Sale | 189 | 241 | +27.5% | 164 | 234 | +42.7% |
| Inventory of Homes for Sale | 161 | 155 | -3.7% | |||
| Months Supply of Inventory | 14.9 | 18.6 | +24.8% |
How are condo and townhome sales going in Snowmass Village? New listings are up a third from last year for the 3rd quarter, up 7.9% from last year on the whole. Sold listings have dropped 26.9% for the year. Median sales price has dropped 38.7% for the quarter but is up 10.7% for the year. Average sales price has risen considerably, 27.9% in 2014 from 2013. Percent of list price remains right around 93%. Days on market has risen a whopping 42.7%. Inventory is down slightly and months of inventory has risen from 14.9 months to 18.6 months. Snowmass Village condo and townhomes market is still very much a buyer’s market however it appears that sellers are willing to wait for a good offer indicated by the amount of days on market and the high percentage of list price received. The market is recovering with a rapidly improving average sales price. There’s still time to get a great deal in the Snowmass Village townhome and condo market but don’t wait until it’s too late!
For more information on the Roaring Fork Valley market please contact Ruth Kruger at 970-404-4001 or visit us on our website www.krugerandcompany.com
International Real Estate Federation FIABCI Adopts Global Ethics Standards
|
Luxury Home Report

The one constant in luxury real estate is change. Change has arrived in many forms over the last decade: a movement from local to global marketing, increased reliance on technology, social media and shifts in consumer preferences. In this edition of the Luxury Market Report, we examine change in the context of:
• America’s top cities and ZIP codes for luxury home
listings and sales
• Market activity in Atlanta and New York
• How ultra-wealthy consumers view real estate
The shifts happening locally and globally point to a robust luxury housing market. You can especially see that change in the lists of top 20 U.S. cities and ZIP codes for luxury home listings and sales on page 6. In fact, four out of the top five U.S. cities—including San Francisco, Los Angeles, San Jose and Houston—were up by double digits. If you would like a more in-depth look at why these cities might be demonstrating strength, the Wealthy Consumer Survey on page 4 could shed some light. Certainly, you’ll get a new picture of modern luxury home buyers, and they are highly interested in acquiring real estate, not to mention tech-savvy and geographically mobile. This is especially true among younger generations; in fact, a majority of those under the age of 35 say that lifestyle considerations—as opposed to location—continue to drive their choices to buy.
This phenomenon has only just begun to play out in Atlanta, where a post-recession real estate recovery is underway. We examine the city’s luxury renaissance on page 13. Dubai is
experiencing a similar post-recession resurgence, which we also explore on page 15. All of these changes hint at a future that is open for expansion. New luxury epicenters are emerging all the time. This year, it was California’s Silicon Valley. Will mountain towns like Aspen and Park City—with all of their outdoor activities and culture—be the world’s next luxury hotbeds? Or what about island destinations like Honolulu or Kailua, with their white sandy beaches? In five years, what will our top city lists look like? It will certainly be interesting to watch.
High Net Worth Consumers and Real Estate/Research and Insights on Preferences and Behavior
The booming market for high-end U.S. residential real estate shows no signs of cooling, according to a survey of ultra-wealthy U.S. consumers with a net worth of at least $5 million. The survey reveals trends in intent to buy, age and gender demographics, a shifting preference toward lifestyle, desired amenities and the influence of social media. Youngest Buyers Most Likely to Make Large Purchase Nearly half (48%) of all respondents say that they plan to purchase a luxury home in the next 12 months, with personal use outpacing investment interest by a three-to-one margin. Purchase intent is far more pervasive among buyers under 35, 81% of whom plan to buy in the coming year. In addition, the youngest buyers are the biggest spenders, paying $7.8 million on average for their last home, compared to $6.8 million for buyers between 35 and 44 years of age, $2.7 million for those between 45 and 64, and $1 million for buyers 65 and older. Especially eager are women. The percentage of wealthy females contemplating buying rose to 46% from 31% in 2013.
RESEARCH AND INSIGHTS INTO PREFERENCES AND BEHAVIOR
HIGH-NET-WORTH CONSUMERS AND REAL ESTATE
You may picture wealthy Gen Y and Millenials as iPad-toting jet setters who aren’t anxious to tie up their cash in a home. But they are among the most active players in luxury real estate, according to a new survey of ultra-wealthy consumers.
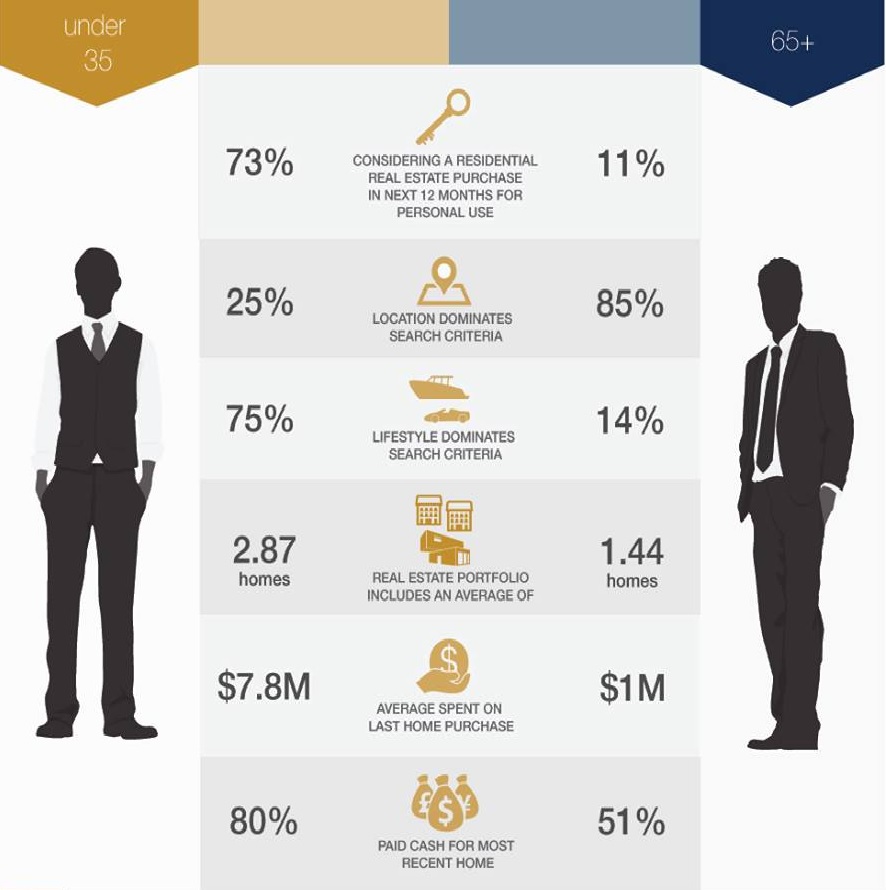
The survey found that 73% of wealthy consumers under the age of 35—the most out of any age group—are considering a purchase of additional residential real estate in the next 12 months for personal use. These buyers also expect their home to appreciate by an average of 16% in the next five years, compared to 13% for buyers ages 45-64 and 11% for buyers 65 and older. Additionally, they are among the biggest spenders, as they paid $7.8 million on average for their last home, compared to $6.8 million for buyers between 35 and 44 years of age, $2.7 million for those between 45 and 64, and $1 million for buyers 65 and older. One reason for the price difference could be due to the kinds of homes they desire. Nearly three-fourths (72%) of respondents younger than 35 said that buying a move-in-ready home is important.
“Our agents in cities like Los Angeles and Miami tell us the same thing: new construction is king right now,” added Wright. “Younger luxury buyers are not looking for a project—they want everything turn-key, right down to the décor and furnishings. All of which, of course, adds to the home’s overall price tag.”
While location and price remain the most important elements in the decision making process for the majority of ultra-wealthy buyers, younger affluents are less inclined to choose a property based on geography. Thanks to convenient travel options and the ability to work from anywhere becoming more widespread, just 25% of the under-35 group reports that location dominates their search criteria, but 75% say that lifestyle considerations drive their choice of which home to buy. At the other extreme, 88% of buyers 65 and older say that location is the most potent driver of their next property search.
Younger affluents are also interested in different home amenities than their seasoned counterparts. Safe rooms (37%), home theaters (36%), pool (34%), outdoor kitchens (33%) and “green” or “eco-friendly” amenities (29%) remain at the top of the wish list for buyers under the age of 35. Compared to the 65+ demographic, those same features ranked far lower: 7% wanted safe rooms, 12% wanted home theaters, 16% wanted a pool, 17% wanted a pool and 10% wanted a “green” home.
Lifestyle vs. Location, Location, Location
Location is a very important consideration when buying real estate, but for a growing proportion of wealthy buyers—and especially younger ones—it’s not everything. With convenient travel options and the ability to work from anywhere becoming more widespread, wealthy buyers are not as tied to any particular geographic area as they were in the past. Just 25% of the under-35 group reports that location dominates their search criteria, but 75% say that lifestyle considerations drive their choice of which home
to buy. At the other extreme, 86% of buyers 65 and older say that location is the most potent driver of their next property search.
Most Popular Amenities Sought by the Wealthy
Most ultra-wealthy buyers are not interested in project homes or fixer-uppers, with 58% saying that the instant gratification of a fully built “turn-key” property equipped and ready to move into is more important now than it was three years ago. The tendency to prefer a move-in ready situation is far more pronounced among younger buyers. Nearly three-fourths (72%) of respondents younger than 35 say that buying a home that’s ready to move into has become more important than it was three years ago. Home features that ultra-wealthy buyers find more important today than three years ago are open floor plans (31%), fully automated home environment (25%) and pools (24%). Nearly one in four buyers under age 35 are including safe rooms and garage for four or more cars in their next homes. Almost one-third of all buyers under the age of 45 were demanding “green” or “low-emission” eco-friendly homes—perhaps a sign of the younger generation’s tendency to incorporate social and environmental considerations in their home purchase. The trend is also catching on among the larger group of wealthy buyers, with 21% saying that
they want to buy an eco-friendly home, up from 7% in 2013.
Influencing Buyers with Social Media
One rapidly evolving, but not surprising, development is that 29% of all those surveyed report being strongly influenced by social media, and that percentage more than doubles among the youngest buyers. On average, 60% of ultra-wealthy consumers under the age of 35 and 42% of those 35-44 report being influenced in their choice of agent by social media, while only 8% of those 45 and over reported such a strong influence from Facebook, Twitter and other sites.
Final Outlook
This survey not only reveals a growing appetite for luxury real estate, but a new picture of the modern-day luxury consumer—a consumer who is increasingly mobile, tech-savvy, cash-focused, socially conscious and less concerned with status. These consumers remain attracted to high-end real estate because of a strong perception of value and the urge to upgrade to homes that facilitate the lifestyle they desire.
Methodology
The New York-based Luxury Institute surveyed 506 ultra-wealthy U.S. consumers age 21 or older with minimum gross annual household income of $200,000 and minimum net worth of $5 million. According to the 2010 Federal Reserve Board Survey of Consumer Finances, these criteria represent the top 1.5 million (1.2%) of U.S. households ranked by wealth. The survey data have been weighted with respect to gender, age, income and region to match the profile of these households according to Federal Reserve and U.S. Census sources.
LUXURY LISTINGS BY CITY
U.S. CITIES WITH THE HIGHEST NUMBER
OF ACTIVE LUXURY HOME LISTINGS
America’s top cities and ZIP codes for luxury home
listings and sales in three distinct price points: $1,000,000+,
$5,000,000+ and $10,000,000+.
$1,000,000+
City State Number of Listings
New York NY 5,005
Miami FL 1,185
Miami Beach FL 897
Los Angeles CA 770
Brooklyn NY 731
Fort Lauderdale FL 729
Naples FL 712
Atlanta GA 622
Greenwich CT 566
Boca Raton FL 544
Houston TX 501
Honolulu HI 493
North Miami Beach FL 460
Park City UT 436
Sarasota FL 365
San Diego CA 362
Las Vegas NV 325
Santa Barbara CA 321
Washington DC 302
Newport Beach CA 301
$5,000,000+
City State Number of Listings
New York NY 1,573
Miami Beach FL 218
Greenwich CT 179
Aspen CO 129
Malibu CA 100
Los Angeles CA 96
Naples FL 90
Miami FL 87
Park City UT 81
Beverly Hills CA 72
Boca Raton FL 72
Santa Barbara CA 69
Fort Lauderdale FL 62
Brooklyn NY 59
Rancho Santa Fe CA 59
Laguna Beach CA 55
North Miami Beach FL 49
Palm Beach FL 46
Honolulu HI 44
Newport Beach CA 42
$10,000,000+
City State Number of Listings
New York NY 685
Miami Beach FL 82
Greenwich CT 51
Aspen CO 49
Malibu CA 44
Los Angeles CA 34
Santa Barbara CA 33
Naples FL 28
Beverly Hills CA 28
Miami FL 27
Laguna Beach CA 24
Brooklyn NY 19
Fort Lauderdale FL 18
Park City UT 18
Palm Beach FL 16
Rancho Santa Fe CA 15
Key Biscayne FL 15
Honolulu HI 15
Boca Raton FL 14
Newport Coast CA 14
LUXURY SALES BY CITY
U.S. CITIES WITH THE HIGHEST NUMBER
OF CLOSED LUXURY HOME SALES
America’s top cities and ZIP codes for luxury home
listings and sales in three distinct price points: $1,000,000+,
$5,000,000+ and $10,000,000+.
$1,000,000+
ZIP Code City State Number of Listings
10021 New York NY 496
33160 North Miami Beach FL 460
10022 New York NY 450
10011 New York NY 354
33139 Miami Beach FL 351
10019 New York NY 311
10023 New York NY 305
06830 Greenwich CT 299
06880 Westport CT 292
10024 New York NY 280
06831 Greenwich CT 267
06840 New Canaan CT 265
81611 Aspen CO 263
10013 New York NY 246
90265 Malibu CA 240
84060 Park City UT 236
10128 New York NY 235
33140 Miami Beach FL 224
92651 Laguna Beach CA 222
20854 Potomac MD 216
$5,000,000+
ZIP Code City State Number of Listings
10021 New York NY 195
10011 New York NY 156
81611 Aspen CO 129
10023 New York NY 124
10013 New York NY 122
33139 Miami Beach FL 110
10022 New York NY 104
90265 Malibu CA 100
06831 Greenwich CT 93
10065 New York NY 89
10024 New York NY 87
06830 Greenwich CT 86
10128 New York NY 77
10014 New York NY 72
90210 Beverly Hills CA 72
10019 New York NY 72
84060 Park City UT 71
10028 New York NY 64
10012 New York NY 58
34102 Naples FL 58
$10,000,000+
ZIP Code City State Number of Listings
10021 New York NY 91
10023 New York NY 79
10065 New York NY 53
10011 New York NY 52
10013 New York NY 49
81611 Aspen CO 49
90265 Malibu CA 44
33139 Miami Beach FL 41
10024 New York NY 41
10022 New York NY 40
10014 New York NY 37
06831 Greenwich CT 34
10003 New York NY 30
10019 New York NY 29
10028 New York NY 28
90210 Beverly Hills CA 28
93108 Santa Barbara CA 27
10075 New York NY 27
34102 Naples FL 25
92651 Laguna Beach CA 24
LUXURY SALES BY ZIP CODE
U.S. ZIP CODES WITH THE HIGHEST NUMBER
OF CLOSED LUXURY HOME SALES
The Coldwell Banker Previews International® program
presents America’s top cities and ZIP codes for luxury home
listings and sales in three distinct price points: $1,000,000+,
$5,000,000+ and $10,000,000+.
$1,000,000+
ZIP Code City State Number of Sales
94010 Burlingame CA 404
90266 Manhattan Beach CA 369
92037 La Jolla CA 348
90272 Pacific Palisades CA 334
92660 Newport Beach CA 319
94025 Menlo Park CA 316
92651 Laguna Beach CA 314
95014 Cupertino CA 306
90049 Los Angeles CA 303
95070 Saratoga CA 301
90210 Beverly Hills CA 295
95120 San Jose CA 292
33160 North Miami Beach FL 273
94087 Sunnyvale CA 273
33139 Miami Beach FL 272
06880 Westport CT 272
94941 Mill Valley CA 270
92130 San Diego CA 269
94539 Fremont CA 269
34102 Naples FL 268
$5,000,000+
ZIP Code City State Number of Sales
90210 Beverly Hills CA 104
81611 Aspen CO 50
94027 Atherton CA 44
90049 Los Angeles CA 40
90265 Malibu CA 38
34102 Naples FL 37
93108 Santa Barbara CA 32
06830 Greenwich CT 30
33480 Palm Beach FL 28
92651 Laguna Beach CA 28
90077 Los Angeles CA 27
06831 Greenwich CT 25
94010 Burlingame CA 25
90272 Pacific Palisades CA 25
33139 Miami Beach FL 24
10013 New York NY 22
10014 New York NY 21
92657 Newport Coast CA 21
10580 Rye NY 21
10021 New York NY 20
$10,000,000+
ZIP Code City State Number of Sales
90210 Beverly Hills CA 28
81611 Aspen CO 16
94027 Atherton CA 14
90077 Los Angeles CA 11
06831 Greenwich CT 11
93108 Santa Barbara CA 10
90049 Los Angeles CA 9
10013 New York NY 8
90265 Malibu CA 8
33480 Palm Beach FL 7
10021 New York NY 7
10014 New York NY 7
33139 Miami Beach FL 6
10011 New York NY 6
33140 Miami Beach FL 6
92651 Laguna Beach CA 6
96740 Kailua Kona HI 6
34102 Naples FL 6
10003 New York NY 5
10023 New York NY 5
DOMESTIC OVERVIEW: ATLANTA
For more than a century and a half, Atlanta has thrived as a commercial and cultural hub of the South, perennially attracting a large influx of new residents drawn to the city’s opportunity and lifestyle. Today, Atlanta is home to some of the nation’s largest companies, including Coca-Cola, UPS and Delta Air Lines, and it also has a thriving community of legal, financial and other well-compensated service professionals.
With this demographic and economic foundation, Atlanta is also home to significant amounts of wealth and a vibrant market for high-end real estate.
Rebound after Recession
After a period of dormancy during and immediately after the recession, Atlanta’s market for homes selling for $1 million or more is experiencing a robust recovery, both in number of homes sold and selling prices. “At one point, Atlanta was probably the second-worst market in the country behind Phoenix, but that’s changed, and now we are seeing multiple offers come in on many of our properties,” says Charlotte Sears, president of Coldwell Banker Residential Brokerage in Atlanta. “We knew we were headed for a nice recovery when we saw people who owned million-dollar homes put them on the market. Sellers
wanted to get on with their lives and buyers were looking for a good bargain, and since prices hadn’t fully recovered, it made for really good buys.”
Investors Spot Opportunity
Sears notes that depressed prices attracted interest from institutional investors, who bought up homes and tightened inventory. “That pushed prices up a little bit; then, the second wave of the recovery was driven by smaller ‘buy and flip’ investors, who took away more inventory, and prices picked up again,” says Sears, adding that corporate relocations to the area and job growth from area employers are helping to boost the current market.
Intense Interest in Buckhead
The hottest neighborhood for luxury real estate in Atlanta right now is the Buckhead community just north of Downtown, which has long been a destination for shopping, dining and entertainment, as well as fine homes. Within Buckhead’s prestigious 30305 ZIP code, sales of homes priced above $1 million tripled in the second quarter of 2014 from the same period in 2012, ( which was a low point), and rose 65% from last year. With an average selling price of $1.85 million, luxury home prices are up 27% in the past two years and 5% higher than in 2013.
Helping to drive interest in Buckhead is Buckhead Atlanta, a large mixed-use development by San Diego developer OliverMcMillan opening this fall. The destination will have 28 restaurants and luxury retailers, including marquee names like Helmut Lang, Hermès and Christian Louboutin. Outside of Buckhead, there is also strong interest in the Sandy Springs, Dunwoody and East Cobb areas northwest of Downtown. Outside of the Interstate 285 perimeter highway, Alpharetta is also surging as luxury home enclave.
Room to Run Higher
Atlanta’s high-end market has potential to continue its run, given the demand and the prices that are still low by national standards.“We did not have the unbelievable run-ups in prices that California or Florida had,” says Sears. “We’ve always been a good value, even at the height of the market, and now Atlanta is more active than ever because of suppressed demand.”
DOMESTIC OVERVIEW: NEW YORK
New York is known as the city that never sleeps, and the same could be said for its red-hot luxury real estate market. Feverish demand at the high end continues to send prices sharply higher on a year-over-year basis. Inventory is also rising, creating market conditions consistent with a seller’s market.
However, buyers still have some negotiating power as long as they know where to look.
Putting Numbers on Market Tightness
Generally, it is true that sellers can command premium prices in the city. However, the degree of negotiability varies widely across neighborhoods. This is driven primarily by the ratio of listings to sales, according to Pat Veling, founder and president of research firm Real Data Strategies. That is why he created two useful numerical scores of sellers’ pricing power: active inventory factor and active list price factor.
The active inventory factor is the ratio of listings to sales, with higher numbers suggesting more leverage for buyers.
The active list price factor is the average listing price divided by the average selling
price. Higher numbers indicate that sellers may be too optimistic on asking prices.
“The idea is to identify which local markets have the greatest-to-weakest demand relative to supply, and which local markets have sellers with homes more realistically priced,” says Veling. “In a perfect world, a buyer would match his or her lifestyle and location interests to those markets that show the highest levels of seller motivation and most realistic price expectations—that is, those with a high inventory factor and a low list price factor.”
However, there are exceptional properties in all markets that only a few buyers can afford. It’s hard to imagine, but in Manhattan, the list price benchmark for those properties is $50 million. Homes at these list prices often sell for cash, are typically full- or multi-floor units in the most upscale buildings and come with priceless views of the city or Central Park that cannot ever be replicated. They also become available so seldom that their transfer values are typically determined entirely by the seller and the buyer, and not by a lender who would value mortgage collateral more objectively through an appraisal. So, in order to create analysis results that are valuable to the largest number of potential buyers, those listed properties priced at $50 million or above have been excluded from the analysis.
“That way, the property and pricing characteristics of these truly exceptional properties do not skew the average list or sale prices to values that far exceed the normal values of nearby properties,” explains Veling. “This type of analysis is an art form, as much as it is a science. This context adds value and better understanding to our results.”
Tale of Two Downtown Markets
Buyers may have room to negotiate on properties in the 10006 ZIP code near the World Trade Center, west of Broadway and east of the West Side Highway. With 78 listings and nine sales above $1 million in the second quarter, this downtown neighborhood has the highest inventory factor of 8.7, meaning that there may be an abundance of available properties relative to recent sales volume.
Just a few blocks can make a big difference, however, when you are looking at market tightness. Battery Park City in the 10280 ZIP code, just west of the gleaming new Freedom Tower at the World Trade Center, has a small supply relative to sales for all neighborhoods. With 15 sales and 13 listings between $1 million and $50 million, Battery Park City has the lowest inventory factor of 0.9.
Room to Maneuver
Buyers may find more flexibility in the East Village and Stuyvesant Town. Sellers of million-dollar real estate in the 10009 ZIP code appear to be looking for prices substantially higher than most buyers have been willing to pay. With an average listing price of $5.78 million and average selling price of $1.45 million, this funky and chic neighborhood sports a high list price factor at 4.0. However, buyers may find more for their money in the resurgent parts of Harlem, from the northern border of Central Park up to 120th Street. The 10026 ZIP code boasts a low list price factor at 1.2. Although the average listing price was $1.9 million in the most recent period, the average selling price was $1.57 million.
TriBeCa Tops Priciest Neighborhoods, Bargains in Harlem
Even after taking these factors into consideration, you will still pay a premium if you want to live downtown. Manhattan’s highest prices for homes selling for at least $1 million in the second quarter were in the 10013 ZIP code, which includes the fashionable TriBeCa neighborhood, as well as parts of SoHo, Little Italy and the West Village. Here, the average selling price was $4.1 million, and the volume of sales at 134 was the fourth highest in all of Manhattan. If you’re willing to head uptown, you may still find some high-end bargains. The Harlem ZIP code of 10027, for example, had an average selling price of $1.38 million—the most modest pricing of all of Manhattan’s neighborhoods.
Of course, Manhattan offers many other neighborhoods. Whether your preference is Soho, Battery Park City or somewhere in between, the value of Manhattan real estate remains strong. For many, having a Manhattan address is still a dream.
To learn more about the international and domestic luxury market call Ruth Kruger today at 970.404.4000 and ruth@krugerandcompany.com or visit us online at www.krugerandcompany.com
This report is compliments of Caldwell Banker Previews International and the Luxury Market Report.
Aspen Art Museum
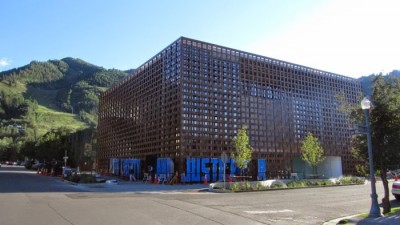
Aspen Art Museum
Aspen, Colo. — The trend in boutique museum building reached a chilly, sun-gilded peak a few years ago and has leveled out, at least in the United States. These days we mostly get unsexy makeovers and add-ons, and the critical conversation has moved on. Still, celebrity commissions appear. A Renzo Piano-designed satellite for the Whitney Museum of American Art is underway in Lower Manhattan. And last month, a new home for the Aspen Art Museum designed by the Japanese architect Shigeru Ban,winner of the 2014 Pritzker Prize, made its debut here.
The building, which opened to a mixed local reception, has its virtues and they are not small; it also embodies some of the absurdities and contradictions that have given “starchitecture” a bad name. Yet the Aspen museum itself as an institution — which is modest in size, collects no art and has free admission — offers, at least potentially, a working model for what a new kind of 21st-century museum, regional or otherwise, could be.
The particular regional setting in this case is a promising one. Aspen, set high in the Rockies, is physically gorgeous. Socioeconomically, it’s a very strange place. Founded as a gold-and-silver mining camp in the 19th century, it is now a migratory perch for a significant percentage of the nation’s financial elite. Dozens of Forbes 400 billionaires own property here. Land-grabbing mansions dot the hillsides. Private jets jam the tiny Aspen airport like a fleet of waiting cabs.

Shigeru Ban in New York in March. CreditYana Paskova for The New York Times
Given that some of those billionaires — Gustavo Cisneros, Leonard Lauder, etc. — are major art collectors, it makes sense that the town, despite its remoteness and primary identity as a ski resort, should have an art museum, though the one that exists today is quite different from what it once was. The original Aspen Art Museum opened in 1979 in a one-gallery space in a repurposed hydroelectric station. For years most of the exhibitions were of local artists, including student shows. Grassroots was the word for it.
With the arrival of Heidi Zuckerman Jacobson as director and chief curator in 2005 — she came from the Berkeley Art Museum — that identity changed. She organized shows by buzzy young East and West Coast figures, with some international artists folded in. A New Yorker would have known every one. After assembling a supportive board, she proposed moving and expanding the museum. In 2007, it commissioned Mr. Ban.
He was a gutsy choice. At that point, like some of Ms. Zuckerman Jacobson’s artists, he was still only a semi-bankable name. He had never built a permanent museum. His reputation rested mainly on his imaginative designs for temporary, disaster-relief housing using cheap, recyclable materials: hollow cardboard tubes, treated paper, canvas tarps, plastic sheeting. He had applied this technology to shelters for victims of natural and man-made catastrophes in Africa, India and Japan. Wherever emergency struck, he seemed ready to go.
His do-gooder bona fides were what sold him to the board members, and they make him a piquant choice for a town in which possession, not dispossession, rules and environmentalism have powerful foes. (The Koch brothers, Charles, David and William, notable opponents to climate control legislation, own significant property here.)
The building he has delivered is a curious one, ugly-beautiful: A three-story glass cube enclosed in thick latticework of waterproofed paper. Where some viewers will see the inspiration of Japanese basketry, others will see a grim, squat cage. The building is shoehorned into a tight corner lot at a downtown intersection, emphasizing both the structure’s 33,000-square-foot bulk and its cultural estrangement from the Victorian-style buildings around it.

A view of the stairs between the woven exterior and the interior glass cube at the Aspen Art Museum.CreditMichael Moran/OTTO
The interior, by contrast, is conventional, with (counting the basement) three levels of plain white-box galleries topped with a, restaurant and terrace with a ski-slope view. Signature elements of Mr. Ban’s disaster designs — molded paper outside, cardboard tubing inside — have been incorporated throughout. And one of the building’s several inaugural shows, “Shigeru Ban: Humanitarian Architecture,” seeks to associate the museum with the architect’s many relief projects.
The exhibition is gripping, with photographs and full-scale examples of tent-like structures he’s made for hard-hit places around the world, from Rwanda to New Orleans (where the show travels this fall). But it has no substantive relationship to the $45 million building it’s in. In this case, paper and tubing are often merely decorative detail. No mention is made of the many nonrelief projects Mr. Ban has undertaken, including the recent design of extremely expensive homes for extremely rich clients, including the Cast Iron House condominiums in Manhattan.
It’s in the nature of art museums to want to paper over yawning gaps between social reality and aesthetic illusion — make them a single, acceptable, excusable thing. I’d go as far as to say that most museums take this as their main task. In this regard, the Aspen Art Museum, judging by its current shows, is typical, no better, no worse.
Another of those shows is, like the Ban exhibition, quite strong. Titled “David Hammons Yves Klein/Yves Klein David Hammons,” it brings together, in a compare-and-contrast way, a pair of familiar artists — the American Mr. Hammons and Klein (1928-62), a Frenchman — who turn out to share unexpected interests: in experimenting with natural materials (rain, fire and sponges in Klein’s case; coal, grease and hair in Mr. Hammons’s), in the economics of immateriality (Klein traded empty space for gold; Mr. Hammons hawked snowballs on the street), and in the use of direct prints of the human body as sensual and political images.
None of this is explained in words, though I wish some of it were. Ms. Zuckerman Jacobson has referred to the museum as a sacred space and refrains from sullying it, or art, with interpretive texts. Even without them, conversations between the works are evident, though it’s easy to imagine some visitors seeing just woozy abstraction with images added. Information, take it or leave it, is good.
The new building’s other exhibitions are conscientiously global, but without surprises. A handful of ceramic pieces by the German artist Rosemarie Trockel tells us little we didn’t know about her. A two-room display of precious-looking abstract drawings by another German, Tomma Abts,is a room too many. An installation by the Chinese artist Cai Guo-Qiang, incorporating live tortoises with iPads fixed to their shells, ran into trouble. Animal-rights groups raised a hullabaloo, and the tortoises were retired ahead of schedule.
Two good shows out of five is better than average, but is “good” enough? The museum clearly wants to position itself within a national and international orbit and beyond regional status. Its way of doing this at present is by importing market-vetted talent from the coastal art centers where Aspen’s flyover collecting class presumably shops.
My question is, why settle for being a New York-Los Angeles outpost? Why not take advantage of the excitements that regional consciousness can offer, and by doing so chip away at the tired East Coast-West Coast hegemony?
The Aspen Art Museum’s founders were wise to create a noncollecting, community-serving museum on the classic European kunsthalle model, a model that assures that even residents of small cities have access to art and some say about the choice of it. Unencumbered by the financial pressures of buying art, the technical demands of caring for it and the urge to expand to store it, the kunsthalle can, ideally, stay light on its feet. When a show ends, everything goes back to where it came from, leaving a clean deck that can be refilled in inventive ways.
At least two major New York institutions had a brush with something like this model in their histories. The New Museum, founded in 1977 as the New Museum of Contemporary Art, decided it would keep no art in its collection for more than 20 years. The Museum of Modern Art, beginning in 1947, sold the Metropolitan Museum certain older works from its holdings to make room for new ones. Both the New Museum and MoMA soon abandoned such policies, but the instinct behind it was refreshing: Don’t get bogged down, pass things along, bring in the constantly changing new.
There has never been more new art in America than there is today. Thousands of art schools and galleries across the country are producing students, to say nothing of artists who work on their own. Only a small fraction of them can, or feel impelled to, relocate to New York, Chicago or Los Angeles. Many smaller cities have vital art scenes of their own, yet no dedicated venues for showcasing it.
A kunsthalle like the Aspen Art Museum, an institution somewhere between a museum and alternative space, should make room for artists closer to home, and in so doing help break up the longstanding art-center stranglehold.
Not all such institutions need the $74.6 million that Ms. Zuckerman Jacobson has raised for her museum. (After the building is paid for there’s still a $29.6 million endowment left.) Indeed, an argument could be made that less-to-lose modest can be better for art, encouraging chance-taking. Still, whether there are megabucks or not, what’s needed first is the will to believe, the will to treat local — what’s here — as big league instead of perpetuating the myth that innovative, important and valuable can emerge only from somewhere else.
Source New York Times
To learn more about commercial real estate in Aspen and discuss the new Art Museum Call Ruth Kruger today at 970.404.4000
or visit us at
What El Nino Could Mean for Aspen Snowfall this Winter

What is El Nino? In the past it has meant record breaking snowfall for all of us lucky to be in Aspen when it happens. What El Nino could mean for Aspen snowfall this winter.
The world’s average temperature is breaking records, and India’s monsoon is in shambles. Borderline El Niño conditions are already here. How much worse will it get?
New data released Thursday by the International Research Institute for Climate and Society—a climate forecasting partnership between Columbia University and NOAA—shows that while ocean temperatures in the tropical Pacific are still above normal, the atmospheric response has so far been sluggish. After an impressive ramp up earlier this year, that means the coming El Niño is increasingly likely to fall a bit flat.
It’s a bit unusual for a building El Niño to dawdle as this one has. On Thursday, forecasters at the IRI scaled back forecasts a bit:
We have a ‘holding pattern’ on #ElNiño development, say Barnston. Probability a bit lower now than what we projected it to be last month.
source IRI

Multimodel ensemble showing #ElNiño development likely for August-September-October period. #IRIforecast
What’s going on is relatively straightforward: El Niño is a phenomenon that occurs simultaneously in the ocean and atmosphere, usually initiated by a subsea sloshing of warm water toward the typically cooler Eastern Pacific. That part has already happened. Since the Pacific is so huge, the gradual emergence of a big swath of warmer-than-normal water during an El Niño eventually prompts something else: a reversal in the local trade winds, which can shift weather patterns worldwide. That’s the part we’re still waiting on. This process needs a reinforcing shot of westerly winds (counter the trade winds’ typical direction) to help dampen the cold water that normally springs up from deep below the ocean’s surface in the East Pacific. So far, the westerly winds have not come, and cold water is beginning to eat away at the burgeoning El Niño.
According to the IRI, the most likely scenario now is a weak-to-moderate El Niño: While forecasts of strength still have uncertainty, we think a weak or moderate event more likely than a strong one, and more likely than no event at all. A weak event now appears just slightly more likely than a moderate one.
The Australian Bureau of Meteorology—which like the United States hasn’t yet declared official El Niño conditions—was even more blunt in its update (PDF) earlier this week: “If an El Niño were to occur, it is increasingly unlikely to be a strong event.”
Just because a moderate-to-strong El Niño event is now less likely than a few months ago doesn’t necessarily change its expected impacts, however. Among the clearest climate signal for the second half of the year? An especially confident outlook for drought in Indonesia:
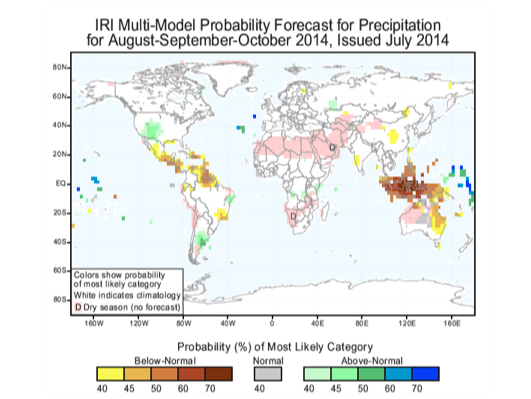
Expected climate impacts, even with weakened #ElNiño signal, haven’t really changed. #Indonesia #IRIForecast
Though rainfall across Southeast Asia has been roughly average in recent months, there’s evidence that El Niño will tip the scale toward drought. If a big drought does occur, it could have profound and lingering consequences worldwide. Large-scale Indonesian forest fires linked to the huge 1997-1998 El Niño released the equivalent of about one-quarter of the world’s human-caused carbon emissions that year. A recent study found Indonesia has now surpassed Brazil as the epicenter of global deforestation, thanks in part to the explosion of palm oil plantations there.
Another interesting development in India is that the Indian Ocean Dipole—a periodic oscillation of ocean temperatures that influences the important monsoon circulation—is moving in the opposite direction of a typical El Niño years, increasing the odds of a poor rainy season there. On Thursday, the Indian Meteorology Department announced (PDF) that monsoon rains had finally reached the entire country, though cumulative rainfall is still running a whopping 37 percent below normal.
Meanwhile, in California, new data on Thursday showed the state’s epic drought has continued to worsen. More than 80 percent of California is now classified as under “extreme” or “exceptional” drought. The prospect of a weaker El Niño bodes poorlyfor heavy drought-busting rains along the West Coast this winter.
This article is compliments of http://www.slate.com/blogs/future_tense/2014/07/17/el_ni_o_2014_forecast_it_s_now_looking_weaker_but_that_s_not_all_good_news.html
Hopefully the El Nino picks up traction and we receive record breaking snowfall that this weather phenomenon brings!
To discuss further call Ruth Kruger at 970.404.4000 for all of your real estate needs.
International Real Estate Market Expanding

International Real Estate Market Expanding
In these 92.2 Billion approximately 5.5 Billion were sales commissions, how much did you profit? And how much do you expect to profit by March 2015?

For the period April 2013 through March 2014, the total sales volume to international clients (“international sales”) has been estimated at approximately $92.2 billion, a 35 percent increase from the previous period’s level of $68.2 billion. Compared to the previous year, sales to foreigners increased both in numbers of transactions and in average price.
For the period April 2013 through March 2014, the total sales volume to international clients (“international sales”) has been estimated at approximately $92.2 billion, a 35 percent increase from the previous period’s level of $68.2 billion. Compared to the previous year, sales to foreigners increased both in numbers of transactions and in average price.
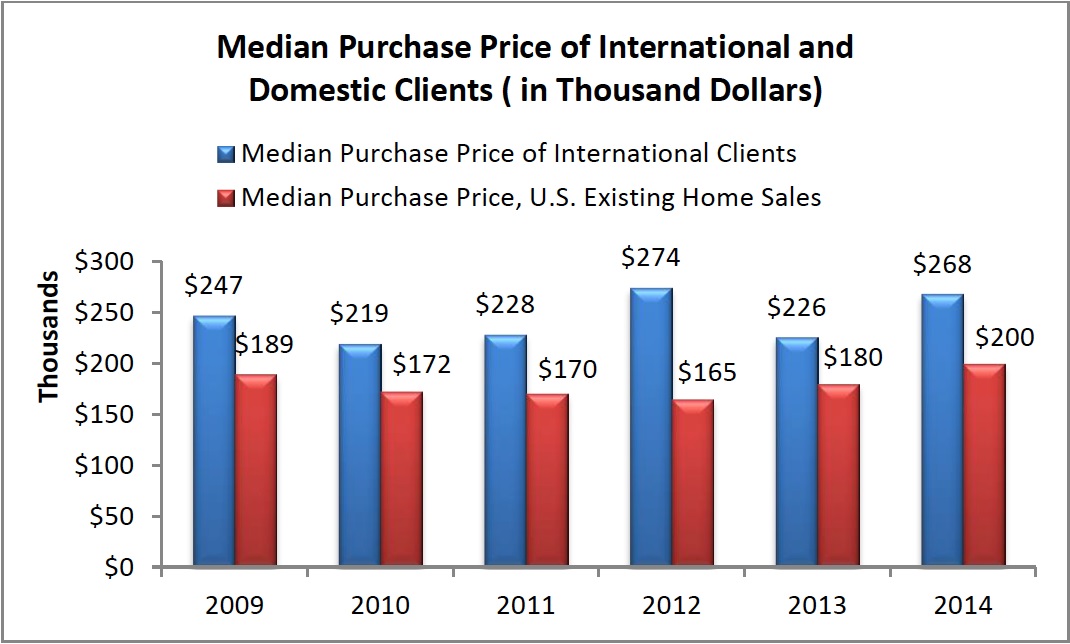 International buying activity apparently was bolstered by continued rising affluence in China, Canada, India, Mexico, and the United Kingdom. In addition, the appreciation of the Chinese yuan and the British pound also made the purchase of U.S. property increasingly affordable for residents of those countries. 3 Purchasing a U.S. property remains affordable with prices still below the peak level attained prior to the Great Recession (December 2007—June 2009). Tight credit standards in the U.S. have also favored buyers paying with cash or making high down payments when presenting a contract for sale. International clients frequently pay cash.
What countries are Buying?
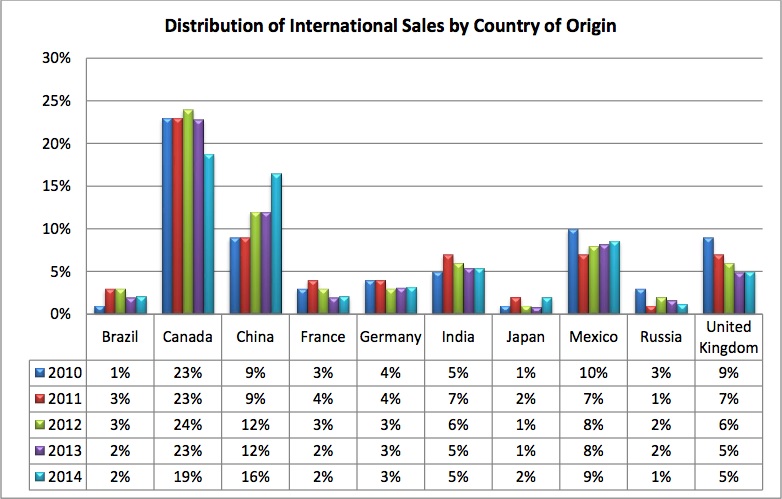
Five countries have historically accounted for the bulk of the reported purchases: namely, Canada, China (PRC, Hong Kong, Taiwan), Mexico, India, and the United Kingdom. In the latest survey, these countries accounted for approximately 54% of the reported international transactions from 61 countries. Canada still accounts for the largest hare of clients, but China is the fastest growing source of clients, now accounting for 16% in the period ending March 2014, up from 9% since this data was collected in 2007.
Source: WGPAS.com
For all of your real estate needs call Ruth Kruger, International Real Estate Specialist today at 970.404.4000.
FIABCI News

FIABCI-USA is on a quest as we continue to build a tradition of excellence in real estate with the Grand Prix event. I’m proud to be leading the effort for the 2014 Grand Prix and on behalf of the Task Force ask for your help. Reach out to those in your communities that you believe would make our competition truly exceptional. Every individual FIABCI-USA member counts as we each join in to bring applicants from our respective communities.
https://www.youtube.com/watch?v=eCpEt0UtVWE
Take a look at the video from last year’s event. I got involved last year and not only made terrific contacts in my home community but also within our FIABCI-USA family and was proud to have had a small part in a truly successful event. The Grand Prix is a passion of mine as I’ve seen how it brings people together around their passion for real estate. The entrants for the 2013 event were stellar. Ask yourself who you could contact in your community that would represent the best of the best. And go out and make a new friend and help them bring home an award.
The 2014 event is shaping up to be another top tier event and your participation is key. The event page is up and gives an outline of the venue. Now, we need your applicants (click to download the application). Feel free to call me with questions on how you can join in.
All the Best,
Lance Fulford
San Francisco/Northern California Local Council President
For all of your International Real Estate needs call Ruth Kruger today at 970.404.4000
Kruger & Company Video

Above see our promotional video for Kruger & Company Real Estate!
For any questions please call Ruth Kruger at 970.404.4000!
Roaring Fork Valley Real Estate Market Update Summer 2014

Summer 2014 Market Commentary Overview
The market is heating up. New listings are on the rise and summer is always busiest in the real estate world. Properties are now selling in an average of 12 months down from 14 months this time last year. Below is the article put forth by Stewart Title with details. Please follow the link for comprehensive charts and statistics.
For the overall residential market (Aspen to Parachute), new listings spiked 65% over last month and exceeded the monthly average of 171 by more than 100 units mirroring the results of June, 2013. The increase resulted from a combination of factors including seasonal norms and improving market conditions. The sharp increase in listings was consistent across most municipalities. Meanwhile, sales slipped slightly in June to 113 closed units from 124 in May also reflecting a pattern seen in June of 2013.
The composite results produced a monthly list-to-sale ratio of 2.44:1 compared to 2.65:1 last year at this time and 1.88:1 YTD.
The increase in inventory moved the absorption rate to just under 12 months compared to nearly 14 months last year at this time. For complete statistics please visit the link below:
http://stewart.com/microsites/297/docs/June_2014_Market_View.pdf
Source: AspenGlenwood Springs MLS
Source: Market Trends, LLC. Glenwood Springs VIEW©stewart.com/glenwoodsprings
To discuss current real estate trends in Aspen and the Roaring Fork Valley call Ruth Kruger at 970.404.4000 or visit our website
FIABCI USA News-60 Years of Consulting with the UN

FIABCI celebrates 60 years of consulting with the Economic and Social Council of the United Nations.
On July 21, 1954 FIABCI obtained Consultative Status with the Economic and Social Council (ECOSOC) of the United Nations. For 60 years now FIABCI has contributed to the development of the property profession through working with ECOSOC and other branches of the UN including UN Habitat, the Economic Commission for Europe and most recently the UN Global Compact.
Below is a copy of our newsletter from 1999 celebrating the annual UN Luncheon – a tradition that will continue next spring.
FIABCI Mission Statement
To open the international community to our members on a local, national and international level so that they may develop a broad base of rea estate contacts that will translate into increased business opportunities and ultimately financial success.
Another Sold Out UN Luncheon
In conjunction with our fall business meetings in New York, FIABCI-USA held its annual luncheon October 14, 1999 at the United Nations, featuring special keynote speaker Ambassador David Aaron, Under Secretary for International Trade, U.S. Dept. Of Commerce.
The annual luncheon celebrates FIABCI-USA’s Special Category II Consulting Status to the Economic and Social Council of the United Nations. More than 120 FIABCI-USA members and their guests listened as Ambassador Aaron discussed the importance of international housing finance, and stressed the role of real estate services in the global economy.
“International trade has been responsible for one third of the total growth of the U.S. economy, and has tripled since 1986,” Aaron said. “The trade deficit last year was $170,000 billion and would have been much worse without services,” which includes real estate. Aaron, a strong advocate for home ownership, acknowledged the important role the real estate industry has played and will continue to play in the international market. “Home ownership has been called the American Dream…and I want to talk to you today about exporting that dream to the rest of the world. Home ownership is an investment in society. So, if we facilitate home ownership among our trading partners, we contribute to the democratization efforts and to strengthening their societies.”
Aaron went on to say that factors such as the increased annual population growth of some larger countries like Brazil, China, and India along with the increased integration of the European Union will all figure significantly into the changing landscape of buying, selling, and financing homes around the world. He urged the audience to pay attention not only to the emerging markets but to our long standing trading partners as well.
Ambassador Aaron also provided attendees and FIABCI-USA members with a handout that summarizes contact information and ways the U.S. Department of Commerce’s International Trade Administration can help you and your U.S. clients in business outside the U.S.
Call Ruth Kruger today for your international real estate needs. 970-404-4000
 Recent Posts
 Categories:
